
Introduction
A successful launch of a pharmaceutical product in European markets hinges on careful and timely preparation to meet stakeholder requirements and expectations. Understanding the payer perspective in the development plan and launch strategy is critical to achieving optimal access, reimbursement, and pricing. Although there are similarities across markets, each European market comprises an unique healthcare system and policies, requiring a tailored approach for each market.
Preparation for market access and HTA assessment should start early in clinical development, with most activities conducted between Phase 2 and Phase 3 trials. All preparatory activities are interconnected; therefore, it is important to understand how activities should be timed relative to each other to avoid inefficiencies and gaps in information.
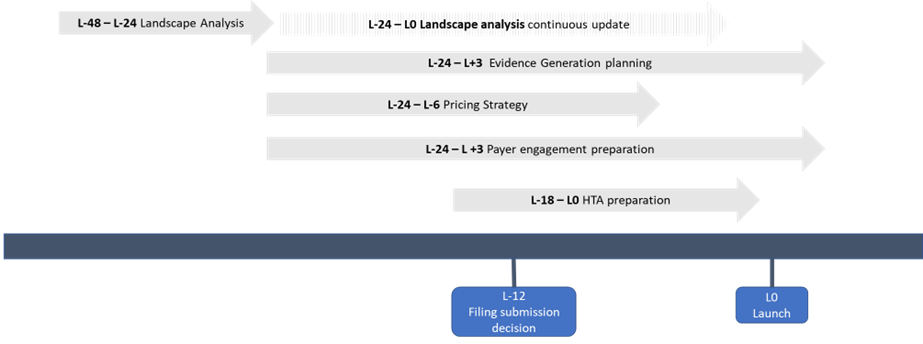
In this paper, we explore some of the key activities and associated timelines to consider when preparing for successful market access and HTA assessments in Europe (Figure 1).
Understanding the current and future landscape is fundamental to inform market access strategy.
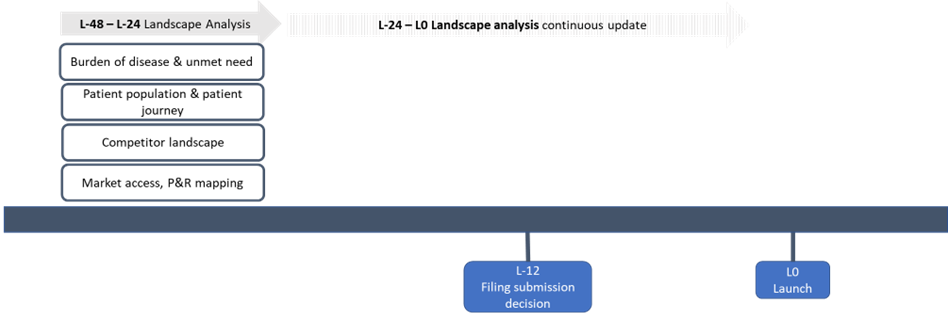
Landscape analysis establishes the environment where the product is placed, including its optimal position in the treatment pathway, potential competitors, and market access landscape. This exercise is important for positioning a product competitively to allow for optimal market access and to inform the evidence generation strategy.Landscape analysis should be initiated early in clinical development, either before or in early Phase 2, with regular updates necessary throughout the development process until launch to adjust the market access strategy for potential changes (Figure 2).
Activities and Timelines
All activities: L-48 – L-0
- Burden of disease & unmet need: This activity aims to understand the clinical, economic and humanistic needs in an indication. The burden of disease considers the epidemiology (i.e. incidence, prevalence, distribution, and causes of death) of a disease, the economic costs associated with the disease, and the number of years of life lost to disease (YLLs) or the number of years lived with disability (YLDs) as a result of the disease. Unmet need research identifies the gaps in the current treatment and establishes the opportunity of a product.
- Patient population and patient journey: This exercise is relevant for positioning the product in the treatment pathway by understanding the patient population and their journey from diagnosis to treatment decisions and how the interaction between stakeholders (patient, HCP, payer) can influence the choice of treatment. It is important to identify leverage points for optimal price and access throughout the patient journey and develop specific tactics to mazimise opportunity at each leverage point.
- Competitor landscape: This activity explores the treatment landscape when the product launches. Treatment standards may change with new therapies launching during the development of the product. Therefore, it is important to identify and assess potential future competitors and how they would be positioned in the treatment pathway at time of the product launch. The reimbursement status and price for existing products are also evaluated to understand market access expectations, including potential challenges faced during the P&R process.
- Market access, P&R mapping: This exercise is important to understand the country-specific P&R processes and funding pathways for specific product types (e.g. drugs with orphan designation, novel medical devices). It identifies the key decision makers and influencing bodies and how they interact, relevant regulations and policies, and potential challenges the product could face.
Generating a comprehensive and robust evidence base is key to supporting market access activities.
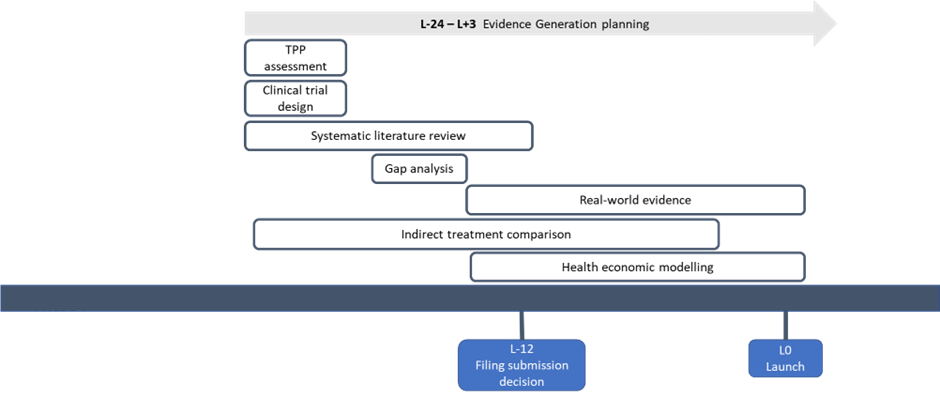
After setting out the environment from the landscape analysis, manufacturers build on the information to create an evidence generation strategy and identify what type of evidence is necessary to demonstrate effectiveness and value to payers and other stakeholders. Evidence generation spans a wide range of activities, with the outputs included in global value dossiers and HTA submissions. Evidence generation planning should start early before the initiation of the pivotal trial and be continually updated to reflect the latest changes in the asset and evidence requirements (Figure 3).
Activities and timelines
- Target product profile (TPP) assessment (L-24 – L-20): A TPP assessment establishes the perceived comparative value of the product within the treatment landscape by identifying payer-specific value drivers and critiques. It is a crucial exercise to inform the Phase 3 clinical trial design as well as shape the payer communication tools. A TPP assessment is usually done with traditional payer research and can be supplemented by a payer advisory board.
- Optimising clinical trial design (L-24 – L-20): This activity specifically aims to inform the pivotal trial design by understanding payer expectations regarding the selected trial population/sub-groups, choice of comparator, primary and relevant secondary endpoints, trial duration and other parameters. It is essential to integrate payer-specific considerations in clinical development.
- Evidence gap analysis (L-20 – L-18): Gap analysis identifies missing components in the existing and planned evidence to support market access activities for the product. Once gaps are understood, a strategy can be put in place to generate additional required evidence.
- Systematic literature reviews (SLRs) (L-24 – L-12): SLRs are considered the gold standard for healthcare decision making as it employs a rigorous, comprehensive, and transparent method for reviewing and synthesizing existing research. SLRs are required for most HTA submissions. Targeted literature reviews may be conducted using a streamlined methodology to guide internal strategy in a time- and cost-efficient manner.
- Indirect treatment comparison (ITC) and network meta-analyses (NMA) (L-24 – L-3): ITCs and NMAs are useful to estimate relative treatment effects between competing interventions. ITCs are typically performed when there is a lack of, or insufficient, evidence from head-to-head comparative trials. The outputs of NMAs and ITCs can be used to inform health economic models to demonstrate added value of a therapeutic over existing therapies or patient management.
- Health economic modelling (L-18 – L+3): Health economic models are important to demonstrate the economic impact of the product. The development of a cost-effectiveness model takes approximately 6 months, while a budget impact model is usually built in 3 months. Early economic models are developed to understand the potential cost-effectiveness or budget impact of a new product whilst it is still in early phase trial. Early models are updated when Phase 3 results are available to support HTA/reimbursement submissions. Models will often require local adaptation to ensure it is relevant for inclusion in the country-specific P&R dossier and to inform local decision-making.
- Generating real-world evidence (RWE) (L-18 – L+12): RWE is generated by analysing real-world data (RWD) from a variety of sources, using different study design and analytical methods. The exact timing for generating RWE will depend on the product and the specific research questions that need to be addressed. In the early phases of product development, RWE can be generated to identify unmet clinical needs, characterize the patient population, and inform the design of clinical trials. In the months prior to and after launch, RWE can be generated to support market access and reimbursement strategies. This may include generating evidence on the real-world effectiveness, safety, and cost-effectiveness of the product, as well as identifying patient populations that may benefit most from the product.
Getting drug pricing right is integral to achieving optimal market access.
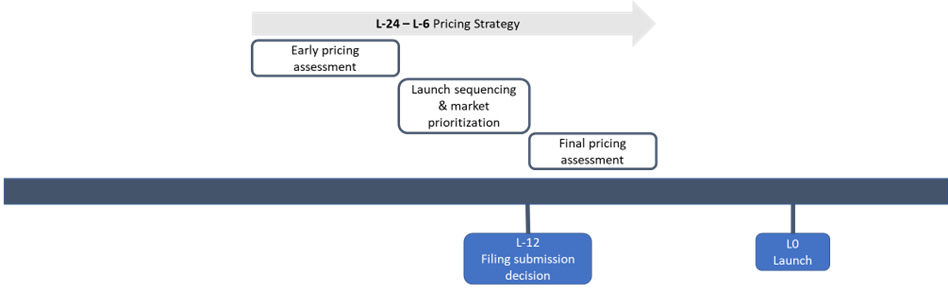
Achieving optimal pricing requires careful consideration of factors such as the product’s clinical and economic value, its place in therapy, the competitive landscape, and the country pricing and reimbursement policies. A global pricing strategy is developed toprovide general guidance on price targets, which is subsequently adapted by country teams to create their own country-specific strategies based on local context and decision drivers. To ensure that pricing decisions align with market needs and expectations, activities related to pricing strategy should be initiated before the start of the Phase 3 clinical trial and updated throughout a product’s development (Figure 4).
Activities and timelines
- Early pricing assessment (L-24 – L-18): This activity can be combined with TPP assessment to initially understand how the proposed product profile translates into monetary value and the payer’s willingness to pay. It also helps to identify specific factors that may impact pricing positively or negatively.
- Launch sequencing and market prioritisation (L-18 – L-12): Following the early pricing assessment, it is essential to initiate a launch sequencing and market prioritisation assessment to determine the optimal order and timing of product launches in different countries. This analysis considers factors such as market size, barriers to market access, price potential, and the use of international reference pricing.
- Final pricing assessment (L-12 – L-6): As interim data becomes available from the Phase 3 trial, it is crucial to conduct a final pricing assessment. This assessment will help to understand how payers perceive the comparative value of the product and how it will translate into price expectations. Furthermore, it can identify the factors that may facilitate pricing and any obstacles that may impede achieving a high price.
Improve payer engagement with tailored value communication to increase probability of market access success.
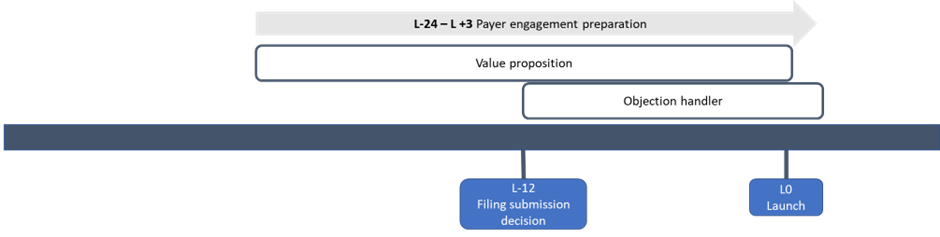
Establishing and demonstrating value to payers is essential to inform P&R decisions and ensure successful market access. Planning a compelling value demonstration strategy in the early stages of product development is critical to ensure that relevant data gathered throughout the clinical development process underpins a target value proposition. Value communication tools should be developed at the start of Phase 3, and subsequently refined, tested, and finalised after the trial’s completion (L-24 – L+3) (Figure 5).
Activities and timelines
- Payer value proposition (PVP): The PVP serves as a key “elevator pitch” to payers, demonstrating the clinical and economic benefit of the product. A draft version of the PVP should be developed 12 to 24 months before launch (L-24 – L-12). The draft PVP should be tested with payers, updated and finalised for launch (L-12 – L0).
- Objection handler: It is necessary to develop an objection handler to anticipate and address potential objections and concerns that payers may have regarding the product or its value proposition. Once the PVP is finalised, an objection handler should be developed, tested with payers and finalised for launch (L-12 – L+3).
Effective HTA preparation is critical to secure market access.
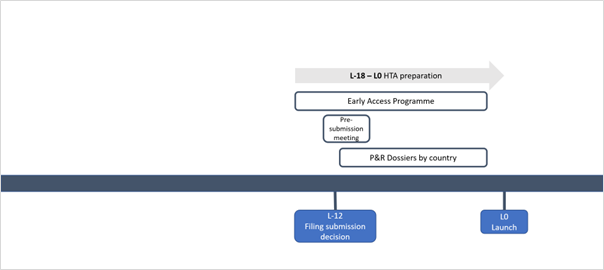
HTA submissions represent a cardinal step in gaining market access for new drugs. Therefore, it is essential to begin HTA preparation early in the product development process. Effective HTA preparation encompasses various activities (Figure 6), including direct communication with payers and KOLs prior to the assessment, participation in Early Access Programme (EAP) where applicable, and preparation of P&R dossiers to be submitted to the relevant evaluation bodies. All activities are carried out at the country level and require country-specific expertise.
Activities and timelines
- Early access programme (EAPs) (L-18 – L0): EAPs can be a valuable strategy for indications with high unmet need, allowing patients earlier access to promising new therapies before regulatory approval. EAPs can also help with the formal reimbursement process by generating RWE to fill evidence gaps and to demonstrate the product’s value to payers. To be effective, EAPs should be in place about 18 months before launch to allow sufficient time for planning, implementation, and data collection.
- HTA engagement / pre-submission meetings (L-12 – L0): Many HTA bodies offer pre-submission meetings to companies about to submit a dossier for pricing and reimbursement. This is an opportunity for manufacturers to align on key assumptions with payers to demonstrate the added value of the product. Ideally, a manufacturer should go prepared to these meetings with draft materials and HEOR models to ensure that the opportunity to engage with actual pricing and reimbursement decision-makers is utilised to its fullest potential.
- P&R dossier preparation: Building a P&R dossier that demonstrates the value of the product is critical for achieving optimal access and pricing, taking into country-specific considerations. The development of the first country HTA dossier can take up to 6 months and it is recommended that the manufacturers start with a more comprehensive dossier like that for NICE in England. The country-specific adaptation of HTA materials can take up to 4 months.
To summarize, systematic and early planning for country-level market access can support manufacturers in securing optimal price and access in a timely manner.